Statistical Report
To compare or analyse a model after curation, some kind of statistis can be very handy. One idea is to analyse the model with memote, however, the report consists - while being every detailed - purely of numerical values. Additionally, if running it multiple times is required, it can be quite time consuming.
refineGEMs provides a quick and gaphic alternative in form of the ModelInfoReport class.
It can produce a report on the main (statistic) properties of a model, including:
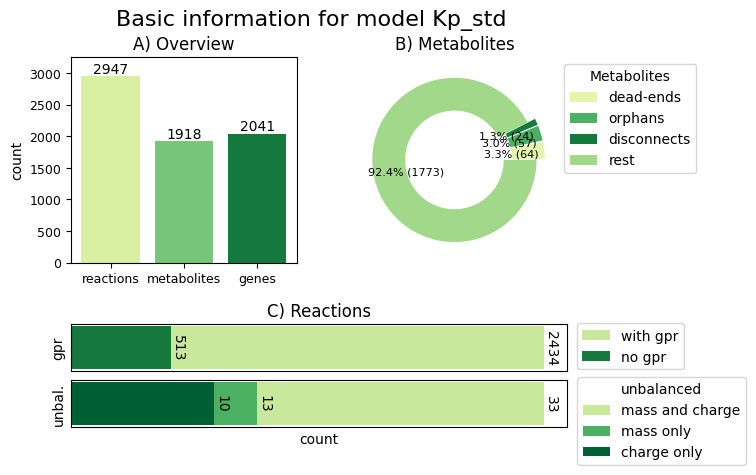
the basic counts of reactions, metabolites and genes
counts of the types of metabolites in the model
number of reactions with and without GPRs
number and types of unbalanced reactions
Furthermore, these values can be visualised as bar and donut chart.
Note
We are currently working a extension of this class that directly produces a report that compares multiple models instead of just one.
How to create the ModelInfoReport
via command line
The basic command is:
refinegems analyse stats MODELPATH
Additionally, the path to the output directory can be added using the flag --dir/-d
and the colours of the plot can be changes by passing a valid matplotlib colour palette
abbreviation to --colors/-c.
inside Python
Assuming a model variable model that contains a cobra.Model entity, the
report can be generated as follows:
report = ModelInfoReport(model)

fig = report.visualise() # produces the graphic

# dir : Path to output directory
report.save(dir) # save the report (graphic + table)
Examplary ModelInfoReport visualisation
An exemplary visualisation of a report on the Klebsiella pneumoniae model generated in the Master Thesis of Carolin Brune is shown below.
The visualisation contains three subfigures, one for the overview (upper left corner),
on for further statistics about the metabolites (upper right) and one for more information
about the reactions in the model (bottom). The colours are the default colour palette YlGn.